Choosing between Vanguard's VOO (Vanguard S&P 500 ETF) and Schwab's SCHG (Schwab U.S. Large-Cap Growth ETF) can be challenging. Both track large-cap U.S. companies, offering low fees, but their distinct characteristics lead to different investment outcomes. This guide leverages ten years of data to illuminate key differences and provide actionable advice for informed decision-making.
Understanding Key Differences: VOO vs. SCHG
Both VOO and SCHG aim to mirror the performance of large US companies, but their underlying strategies and resulting performance profiles diverge. This deep dive analyzes these differences to help you choose the ETF that aligns best with your investment goals and risk tolerance.
Expense Ratios: A Minimal Difference
Both ETFs boast impressively low expense ratios: VOO at 0.03% and SCHG at 0.04%. This negligible difference in annual fees shouldn't be the primary deciding factor in your choice. The impact on overall returns is minimal, allowing us to focus on more substantial factors.
Long-Term Performance: A Notable Discrepancy
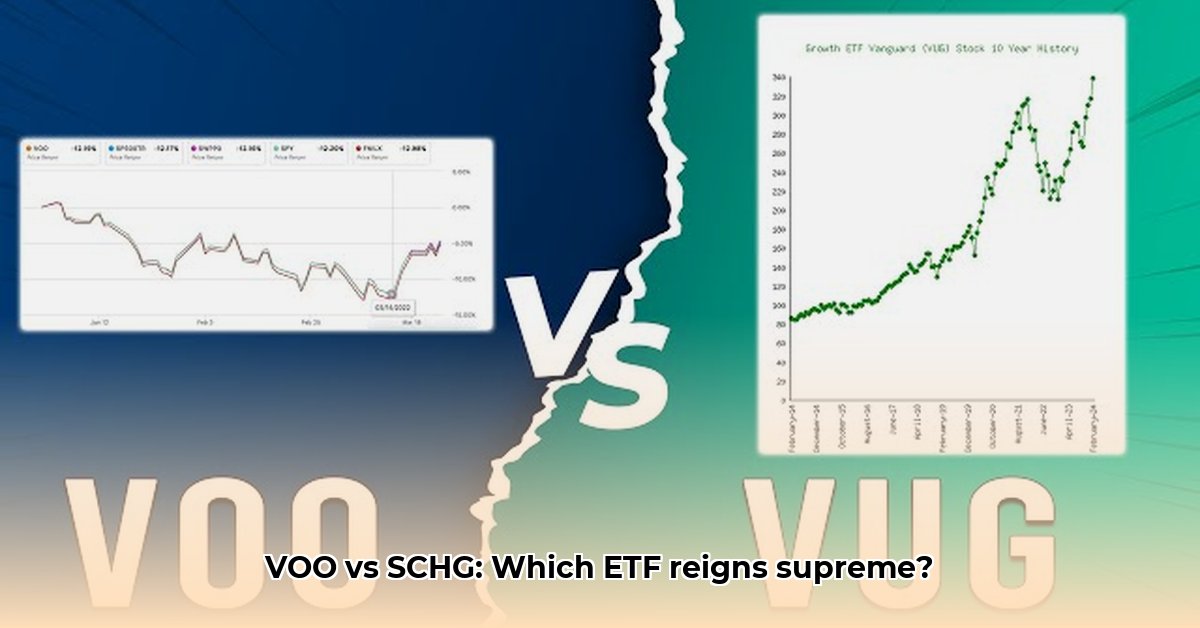
Over the past decade, SCHG demonstrated significantly stronger performance than VOO, achieving an annualized return of 16.53% compared to VOO's 13.25%. This suggests that SCHG's growth-oriented strategy outperformed VOO's broader market tracking approach during this period. However, it's crucial to remember that past performance is not indicative of future results. Market dynamics are constantly evolving.
Is a higher long-term return always better? Consider your risk tolerance before prioritizing this metric.
Short-Term Performance: Context is Key
While VOO slightly outperformed SCHG year-to-date (3.31% vs 2.51%), this short-term fluctuation shouldn't overshadow the long-term trend. Short-term market movements are inherently volatile and shouldn't dictate long-term investment strategies.
Risk and Volatility: A Spectrum of Choices
SCHG’s superior long-term returns come with increased volatility (5.68% vs VOO's 3.40%). This means its price experiences larger swings, both upward and downward. VOO offers a smoother, less volatile ride. Your risk tolerance—your comfort level with market fluctuations—is a critical factor in your choice.
How much fluctuation are you comfortable with in your investment portfolio?
Dividend Yields: Income vs. Growth
For income-seeking investors, VOO's significantly higher dividend yield (1.20% vs SCHG's 0.39%) is a key advantage. SCHG's lower dividend reflects its focus on reinvesting profits for potential growth, emphasizing capital appreciation over immediate income.
Maximum Drawdowns: Navigating Market Corrections
Both ETFs experienced substantial drawdowns of approximately -34% at their lowest points. However, the timing and duration of these drawdowns are crucial. Further analysis of the specific events triggering these declines could reveal valuable insights into each ETF's resilience during periods of market stress. This deeper dive into drawdown specifics is critical for a complete risk assessment.
What strategies will you employ to mitigate the impact of potential future drawdowns?
Choosing the Right ETF: A Personalized Approach
The ideal ETF depends entirely on your individual investment objectives, risk tolerance, and time horizon. This decision matrix offers tailored guidance:
| Stakeholder | Short-Term (0-1 Year) | Long-Term (3-5 Years) |
|---|---|---|
| Aggressive Growth Investor | Consider SCHG, accepting higher volatility. | Maintain SCHG, diversifying across asset classes. |
| Balanced Investor | Monitor both; adjust allocation based on market conditions. | A mix of VOO and SCHG could be beneficial. |
| Conservative Investor | Favor VOO for stability and higher dividend yield. | Maintain VOO, cautiously considering SCHG for growth potential. |
| Income-Seeking Investor | Prioritize VOO for its superior dividend yield. | Maintain VOO, exploring other high-yield options. |
Actionable Steps: Making Your Decision
Assess Your Risk Tolerance: Honestly evaluate your comfort level with market fluctuations. Are you conservative, moderate, or aggressive?
Define Your Investment Goals: Are you focused on long-term growth, income generation, or a balance?
Review the Key Differences: Reconsider the expense ratios, long-term and short-term performance, volatility, dividend yields, and maximum drawdowns discussed above.
Consult a Financial Advisor: Before making any investment decisions, consult a qualified financial advisor for personalized guidance.
Risk Assessment Matrix: A Summary
| Factor | SCHG | VOO |
|---|---|---|
| Volatility | High | Moderate |
| Growth Potential | High | Moderate |
| Dividend Yield | Low | High |
| Expense Ratio | Very Low | Very Low |
| Market Correlation | High | High |
This guide provides a framework for your decision; however, remember that market conditions are dynamic, and past performance doesn't guarantee future results. Thorough research and professional counsel are crucial for making informed investment choices.